In this blog post, I am sharing information about how to add chart annotation to the analytic list page(Fiori elements).
SAP Fiori elements is a framework that comprises the most commonly used floorplan templates and is designed to:
Speed up development by reducing the amount of frontend code needed to build SAP Fiori apps.
Drive UX consistency and compliance with the latest SAP Fiori design guidelines.
Analytic Page
The analytical list page (ALP) offers a unique way to analyze data step by step from different perspectives, investigate a root cause through drill down, and act on transactional content. All this can be done seamlessly within one page. The purpose of the analytical list page is to identify interesting areas within datasets or significant single instances using data visualization and business intelligence.
Visualizations help users to recognize facts and situations and reduce the number of interaction steps needed to gain insights or to identify significant single instances. Chart visualization increases the joy of use and enables users to spot relevant data more quickly.
The main target group is users who work on transactional content. They benefit from fully transparent business object data and direct access to business actions. In addition, they have access to analytical views and functions without having to switch between systems. These include KPIs, a visual filter where filter values are enriched by measures and visualizations, and a combined table/chart view with drill-in capabilities (hybrid view). Users can interact with the chart to dig deep into the data. The visualization enables them to identify spikes, deviations, and abnormalities more quickly, and to take appropriate action right away.
Use of analytic list page:
- Users need to extract key information to understand the current situation or identify a root cause. The way the data is presented is crucial for giving them the insights they need to take the right action.
- Users need a way to analyze data step by step from different perspectives, investigate a root cause through drill down, and act on transactional content within one page.
- In addition to the filtered dataset, users need to see the impact of their filter settings in a chart (visual filter).
- Users need to switch between integrated chart and table views (hybrid view).
- Users need to see the impact of their action on a global key performance indicator (KPI).
- Users need to find and act on relevant items out of a large set of items by searching, filtering, sorting, grouping, drilling down, and slicing and dicing.
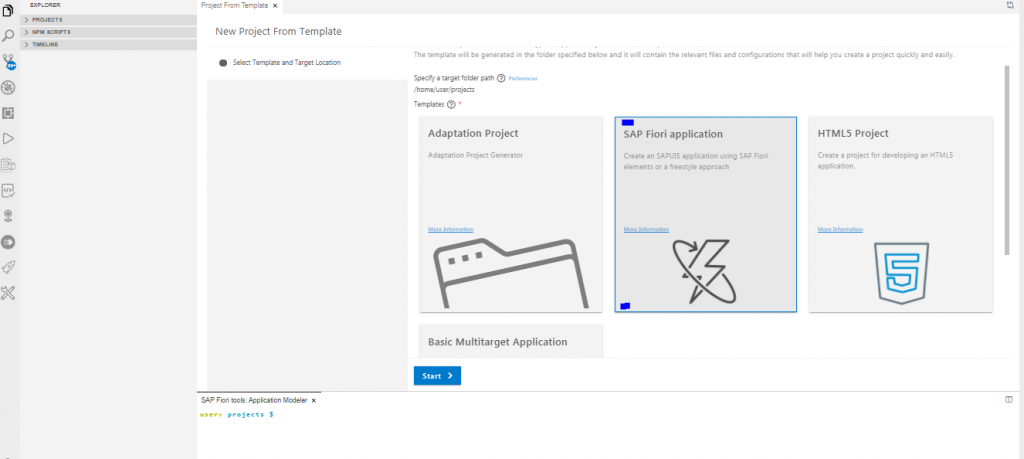
Follow the below step to create Analytic List Page
Step: 1
Go to – File > New Project From Template > SAP Fiori Application
Click Next
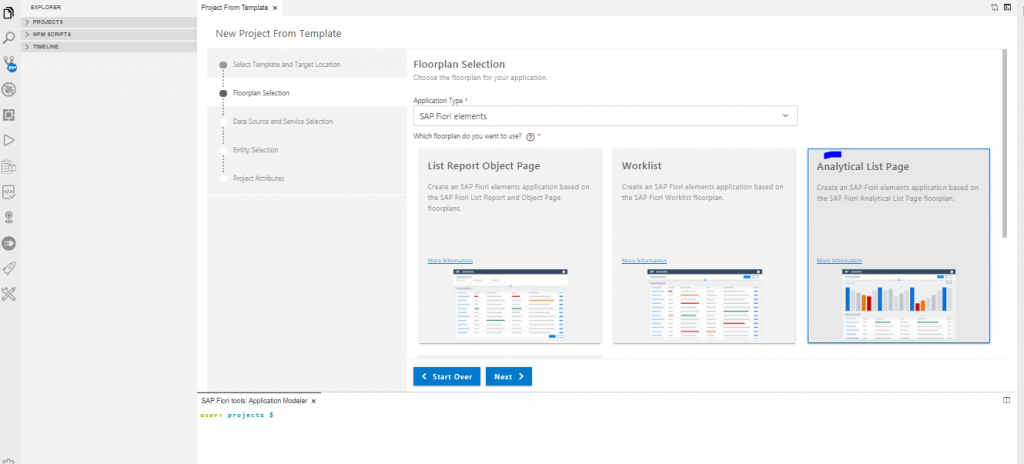
Step: 2
Select SAP Fiori Elements from the Application type dropdown. Select Analytic List Page.
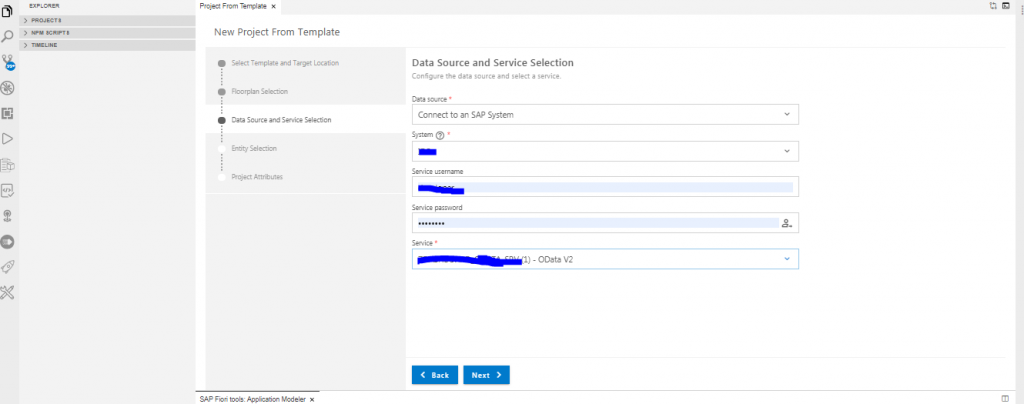
Step: 3
Select Data source, System, Service username, and password
Username and password must be the same as your backend system username and password.
Select Specific service form list and click next.
Step: 4
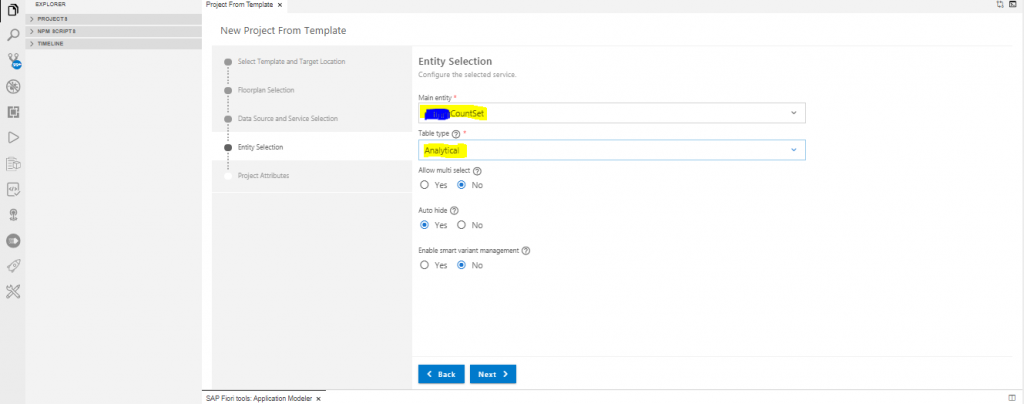
Select your main entity from the list and select Table type.
Step: 5
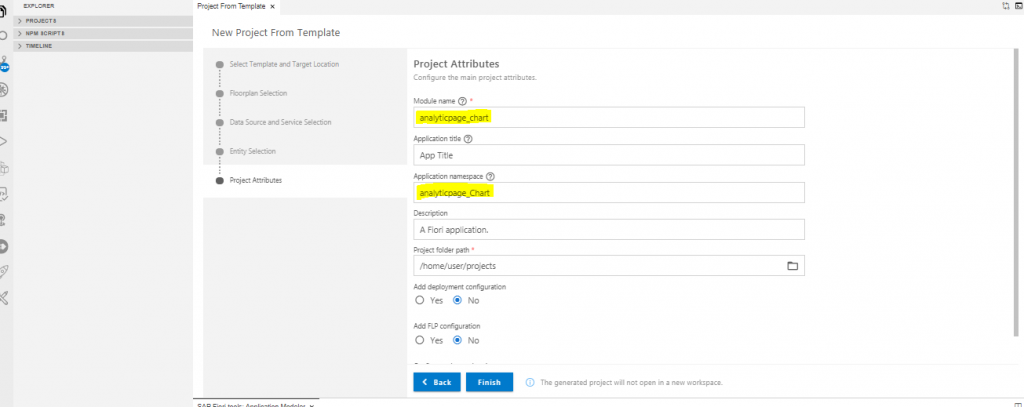
Give the project name and namespace of your project.
Click finish.
Step: 6
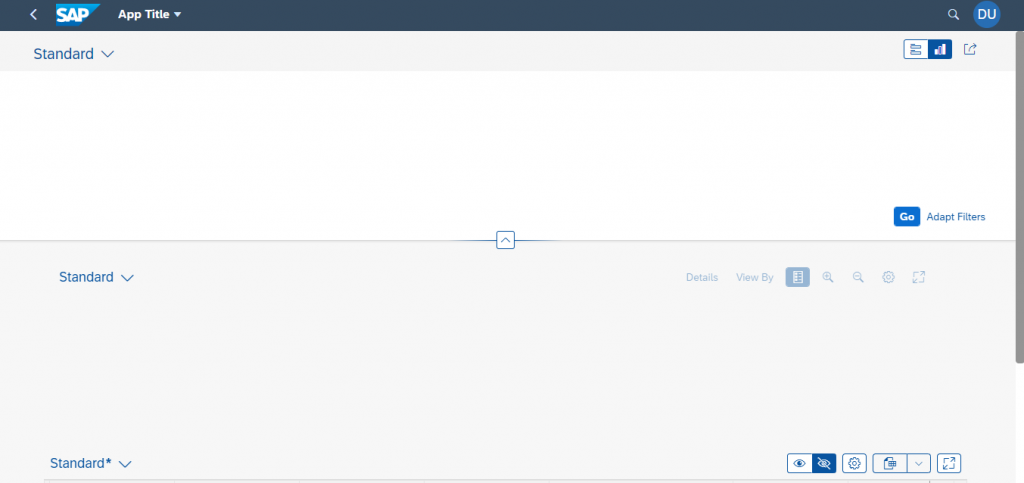
After clicking on finish, you see that your newly created project is in your project list.
Now just simply right-click on the project name and select preview application.
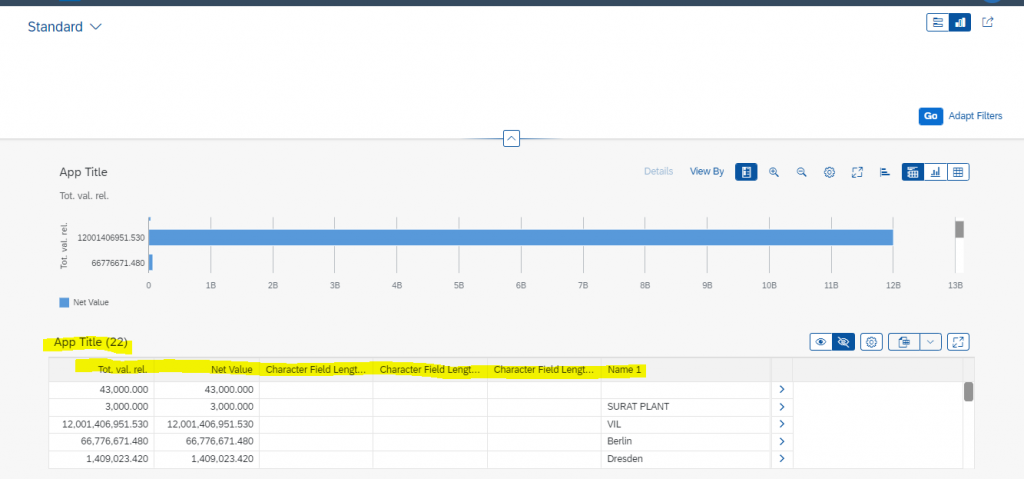
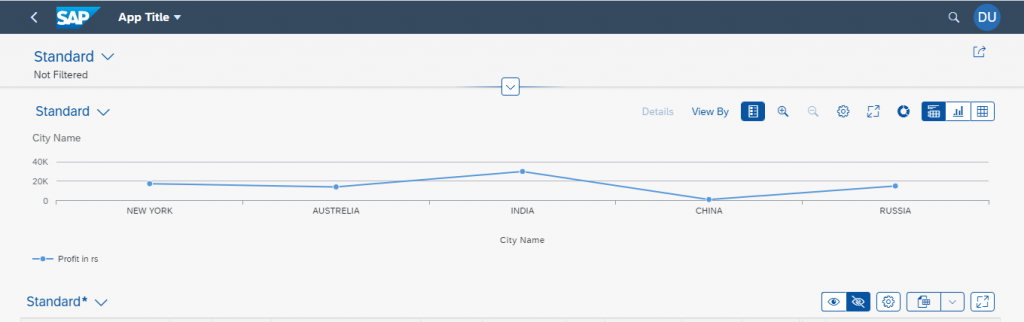
You see that below screen
Step: 7
Open your annotation file from the project webapp folder
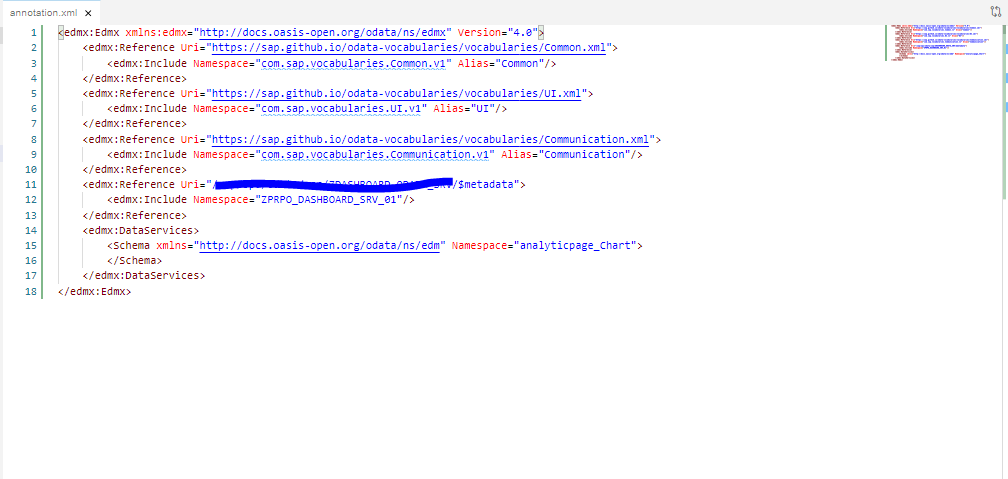
Step: 8
Now add the below code for a chart in the annotation schema section.
<Annotations Target="write your target name (select using ctrl+space)">
                <Annotation Term="UI.Chart">
                    <Record Type="UI.ChartDefinitionType">
                        <PropertyValue Property="ChartType" EnumMember="UI.ChartType/Bar" />
                        <PropertyValue Property="Dimensions">
                            <Collection>
                                <PropertyPath>Rlwrt</PropertyPath>
                            </Collection>
                        </PropertyValue>
                        <PropertyValue Property="MeasureAttributes">
                            <Collection>
                                <Record Type="UI.ChartMeasureAttributeType">
                                    <PropertyValue Property="Measure" PropertyPath="Rlwrt180p" />
                                    <PropertyValue Property="Role" EnumMember="UI.ChartMeasureRoleType/Axis1" />
                                </Record>
                            </Collection>
                        </PropertyValue>
                        <PropertyValue Property="Measures">
                            <Collection>
                                <PropertyPath>Rlwrt180p</PropertyPath>
                            </Collection>
                        </PropertyValue>
                        <PropertyValue Property="DimensionAttributes">
                            <Collection>
                                <Record Type="UI.ChartDimensionAttributeType">
                                    <PropertyValue Property="Dimension" PropertyPath="Rlwrt" />
                                    <PropertyValue Property="Role" EnumMember="UI.ChartDimensionRoleType/Category" />
                                </Record>
                            </Collection>
                        </PropertyValue>
                    </Record>
                </Annotation>

            </Annotations>
Step: 9
Preview of your application
Step: 10
if you want to see the selected field of table write a new annotation into the annotations section.
add below annotation in your file
<Annotation Term="UI.LineItem">
                    <Collection>
                        <Record Type="UI.DataField">
                            <PropertyValue Property="Value" Path="Rlwrt" />
                        </Record>
                        <Record Type="UI.DataField">
                            <PropertyValue Property="Value" Path="Rlwrt180p" />
                        </Record>
                        <Record Type="UI.DataField">
                            <PropertyValue Property="Value" Path="Day180" />
                        </Record>
                        <Record Type="UI.DataField">
                            <PropertyValue Property="Value" Path="Day30" />
                        </Record>
                        <Record Type="UI.DataField">
                            <PropertyValue Property="Value" Path="Day90" />
                        </Record>
                        <Record Type="UI.DataField">
                            <PropertyValue Property="Value" Path="Name1" />
                        </Record>
                    </Collection>
                </Annotation>