
By this time we are optimistic that all the readers are conversant with the creation of Projects in SEGW, mapping of the Data Models, Navigation, Service creation and Testing URIs. Assuming that you have gone through the previous six tutorials on SAP Netweaver Gateway and OData Services. If you have not, please spare some time aside from your busy schedule and invest it on educating yourself in coming days. We believe, every ABAPer would need to have a good grasp of OData and SAPNetweaver Gateway development concepts.
Once we start working on real projects, our developments would not be as simple as shown in the tutorial exercises. We get weird errors/issues ranging from Authorization to Configuration to Code issues. As an ABAPer, we need to learn how to find the root cause of the issues and mitigate them. Today, let us venture further and understand how we will be handling these services, the issues and changes in actual real project scenarios.
In this article, I will help you understand how any developer will be able to track issues and defects in the OData models. What can be an ABAPer’s best friend when it comes to tracing the issues and fixing defects. You guessed it right. Debugging and Tracing Tools are ABAPer’s life lines. Let me show you how to debug and trace any service in SAP Netweaver Gateway.
1. Debugging OData Services
Let us consider the simple model as below.
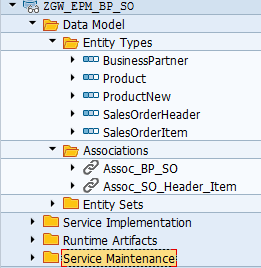
To get the all Business Partner details the below URI is used.

Now if you want to debug the data just add the syntax ‘&sap-ds-debug=true’ at the end. And you thought you need to put ‘/h’. Right? You can still do that. But passing ‘&sap-ds-debug=true’ parameter in the URL is more convenient while debugging services.

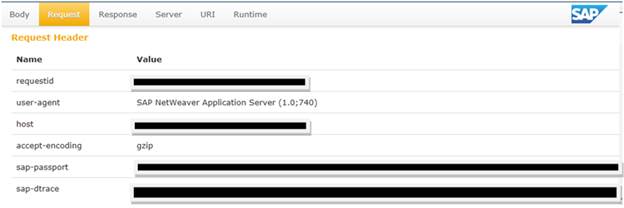
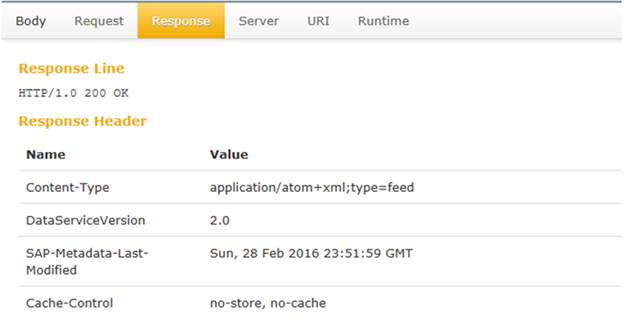
Hit Execute button on the top. The below screen appears with additional tabs like Body, Request, Response, Server and Runtime. Check each of the tabs to understand the features. Some of the relevant screenshots are below which are self-explanatory. If you still have questions, please feel free to write to us and we would be happy to elaborate them.
In the ‘Server’ section it will show the path.
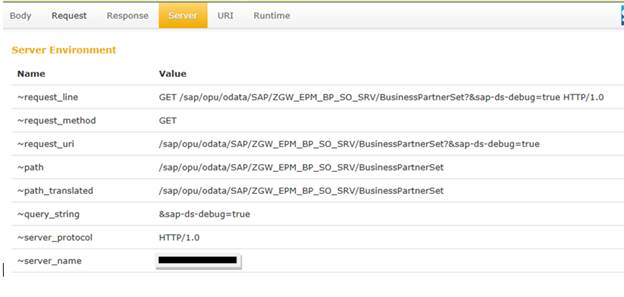
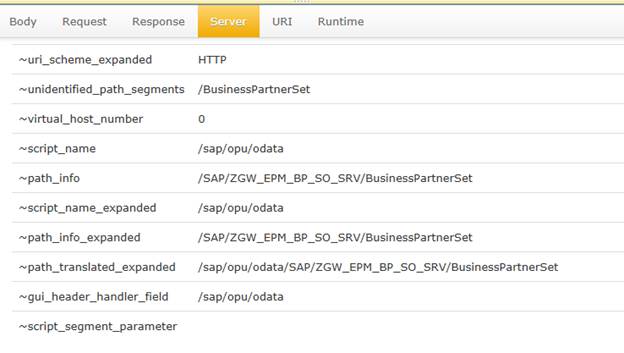
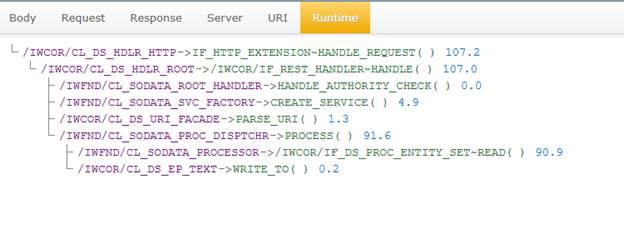
This debug syntax can also be used in the URI directly in the web server. It will help us understand the flow and fix the issues.
2. Trace OData Services
Below steps will help us understand how to trace any OData service.
Execute transaction ‘/IWFND/TRACES’.
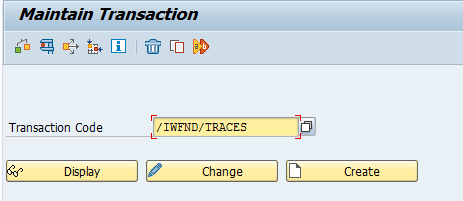
Select the above 2 boxes and Press return/enter.
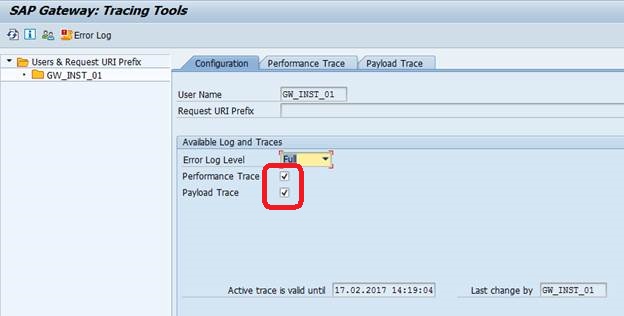
Now execute any query, say as below.

Go to Trace and hit Refresh.
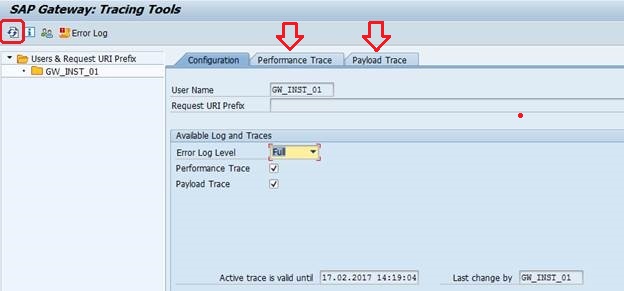
Now check the ‘Performance Trace’ and ‘Payload Trace’ tabs.
i. Performance Trace

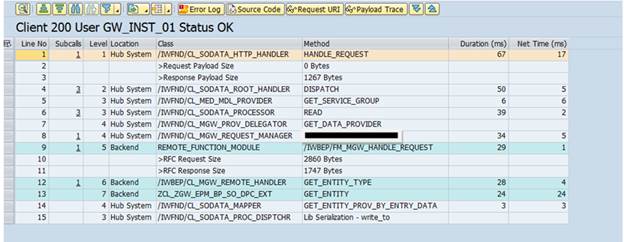
Double click on the above line. The below screenshot will be displayed.

The above image explains how much time each section in the process is taking.
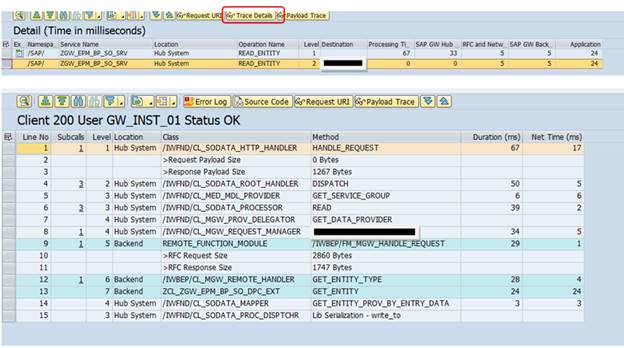
Click on the 1st line and ‘Trace Details’ button.

It will give the trace details.
You can check the ‘Source Code’, ‘Payload Trace’, ‘Error Log’ etc.
Now click on the 2nd line of the trace log and check the ‘Trace Details’.
ii. Payload Trace

Double click on the above line.

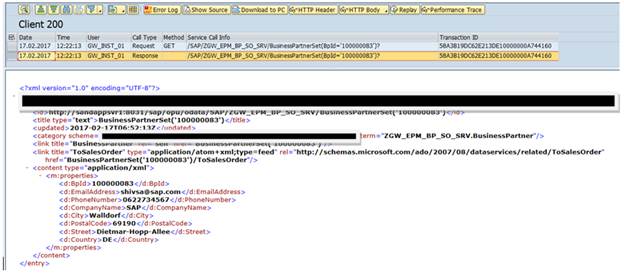
Click on ‘HTTP Header’ in the above screen.
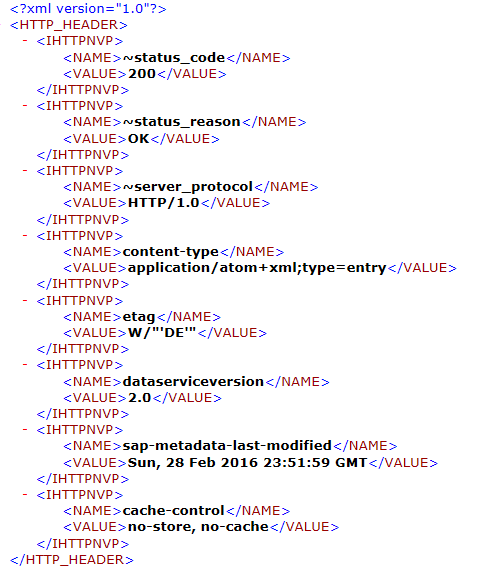
Click on ‘HTTP Body->Original Payload’.
3. Cache Cleanup
Run transaction ‘ /IWFND/CACHE_CLEANUP’.

Execute to Cleanup the Cache.

Sometimes after changing or fixing any code, the changes does not get reflected in the web browser. In such cases, Cache needs to be cleaned/refreshed. Do you remember, we have similar issues in Workflow changes as well? And we need to run one particular t-code to refresh the Workflow modification to take effect. What is the t-code?
4. F4 Help in OData Services
Sometimes we may need to leverage SAP Search Helps in the Web Server. Meaning, we want to implement the search functionality in our applications that consumes OData Services. We do not need to worry much. This can be easily achieved as shown below.
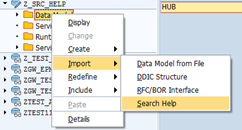
In your SEGW Project, Import the Search Help name (just like you import DDIC structure).
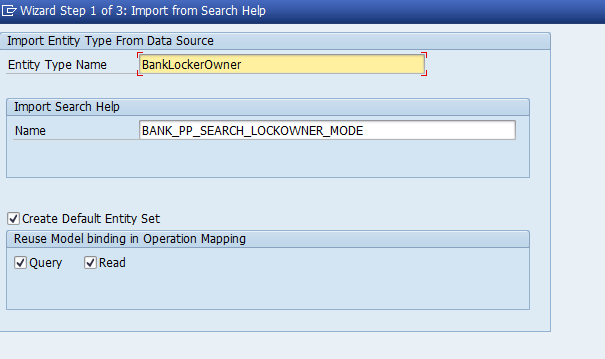
And then proceed with the selection of the fields and mapping as per the requirement which is pretty straight forward.


