The idea of Data Warehouse Cloud (DWC) is to build a bridge between different users by combining the advantages of the Business Warehouse (BW) with the computing power of the HANA Cloud in a self-service concept. So, what does this mean? For example, the IT experts and business users keep the benefits of their BW and the data scientists can stay in their favorite environment, leveraging machine learning directly in HANA cloud. Further, the business users can easily prepare and tune the data by themselves through the data builder in DWC.
Let’s see how all these stakeholders can work together at a concrete use case.
What will you learn in this Hands-On tutorial?
- Understand the setup of the different components ranging from DWC to machine learning.
- Leverage native HANA machine learning in combination with DWC.
- Join different datasets through the self-service data preparation capabilities in DWC.
What are the perquisites?
- Please have your favorite Python editor ready. I used a Jupyter Notebook with Python Version 3.6.12.
- Of course, you will need a DWC. The underlying HANA Cloud must have at least 3 CPUs and the script server must be enabled.
- Download the Python script and the data from the following GitHub repository.
What is the Use Case?
- The IT expert will configure the setup in DWC and enable the native machine learning functionalities in HANA cloud.
- The data scientist will establish a machine learning model directly in HANA cloud, saving the predictions in a new table.
- The business user then joins and prepares the data as needed, to incorporate the new insights into their decision making.
Let’s jump right in. As the IT expert you first need to configure the setup in DWC. Move to the “Space Management” on the left.
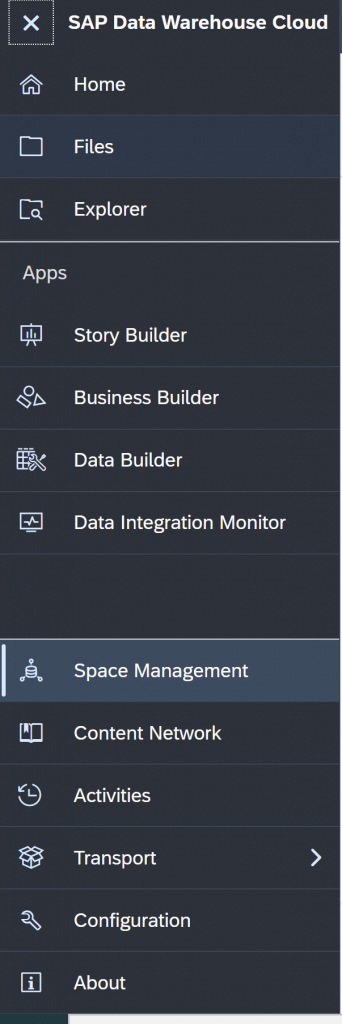
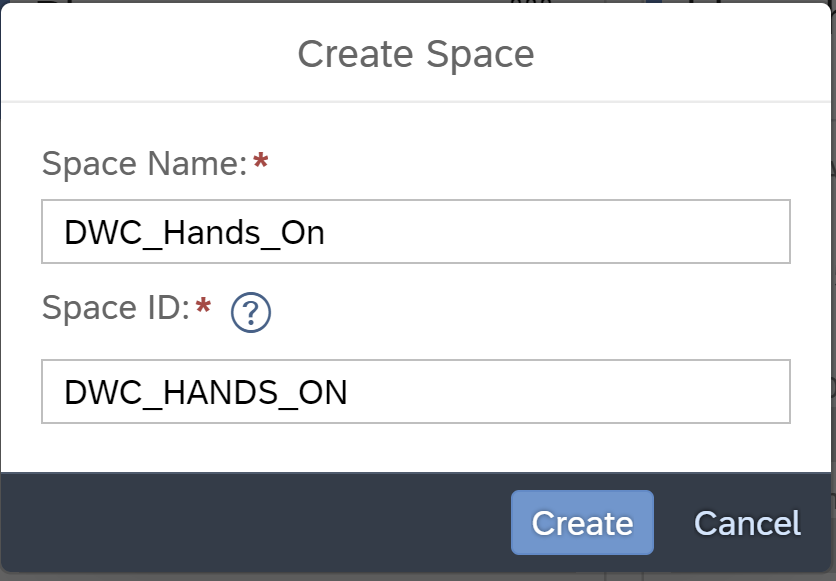
In the Space Management create a new space through the “plus sign” at the top. The space will be the business users own personal working area to prepare and tune the data.

Hence, give your space a name and click “Create”.
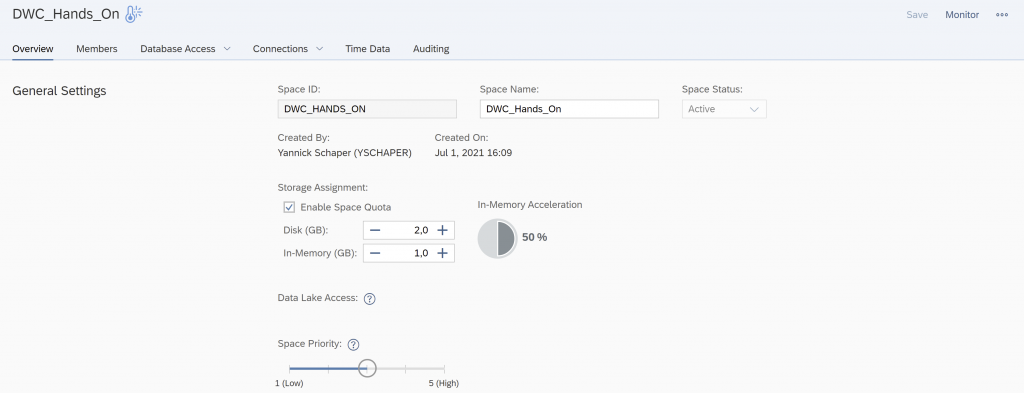
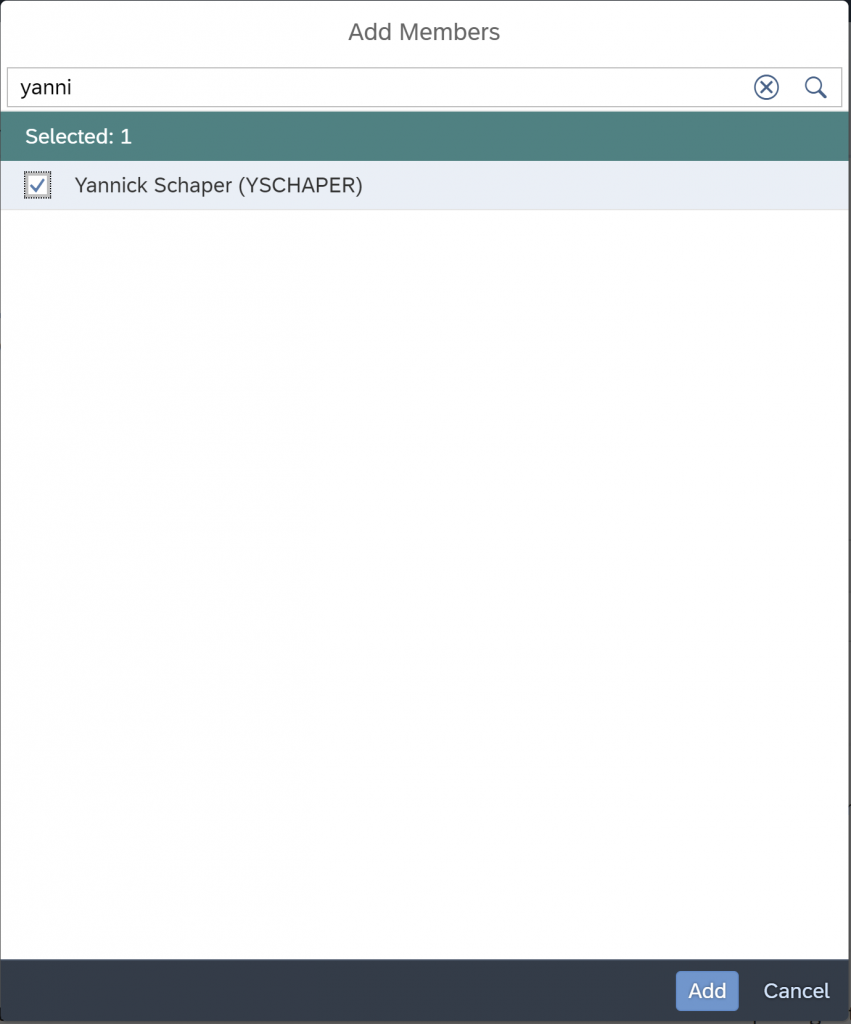
Add yourself as a member to the new space.

Click “Add” and search for your username.
Next, create a Database User for the data scientist, who can then directly work with the SAP HANA database. Go to Database Users and click “Create”.

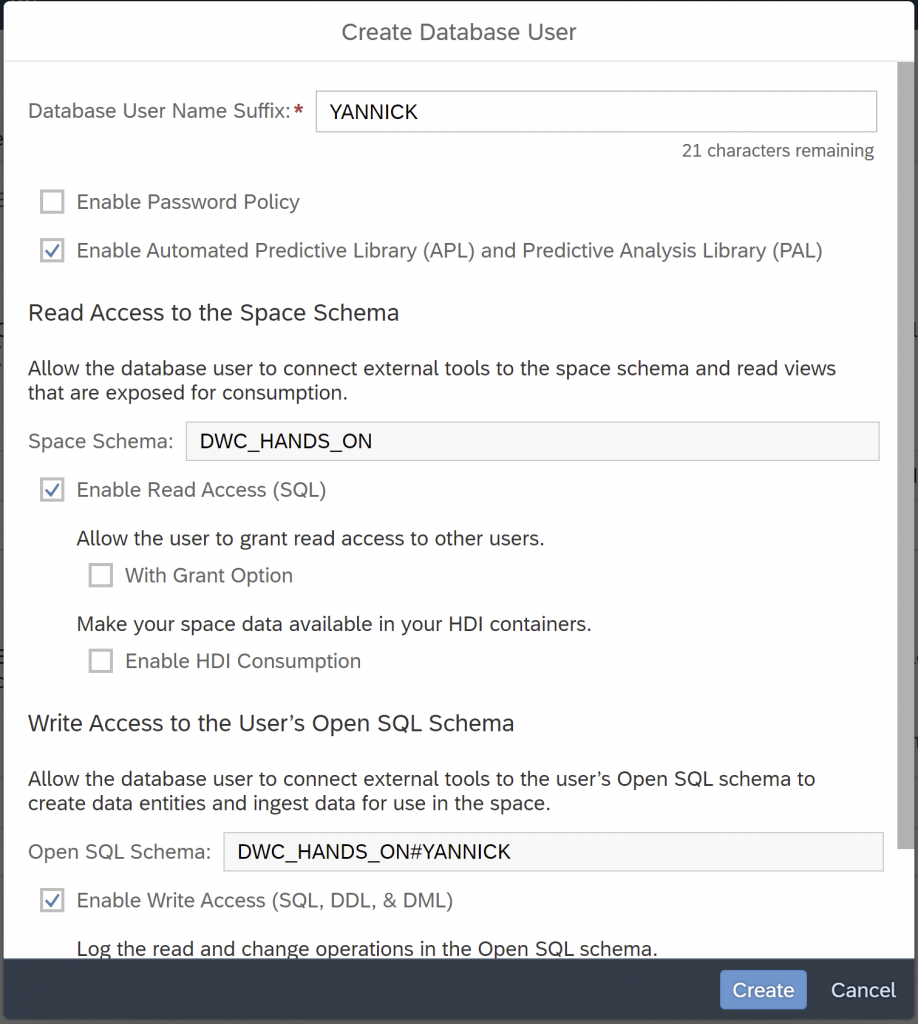
Name the user and make sure to enable the Automated Predictive Library (APL) as well as the Predictive Analysis Library (PAL). These libraries reside natively in HANA cloud, bringing the machine learning algorithms to the data. The APL takes care of all the difficult, statistical questions for the user, while the PAL is reserved for the expert.
Further, enable the read and write access. Click “Create”.
You then receive your Database User details. Please take note of them for the next step.
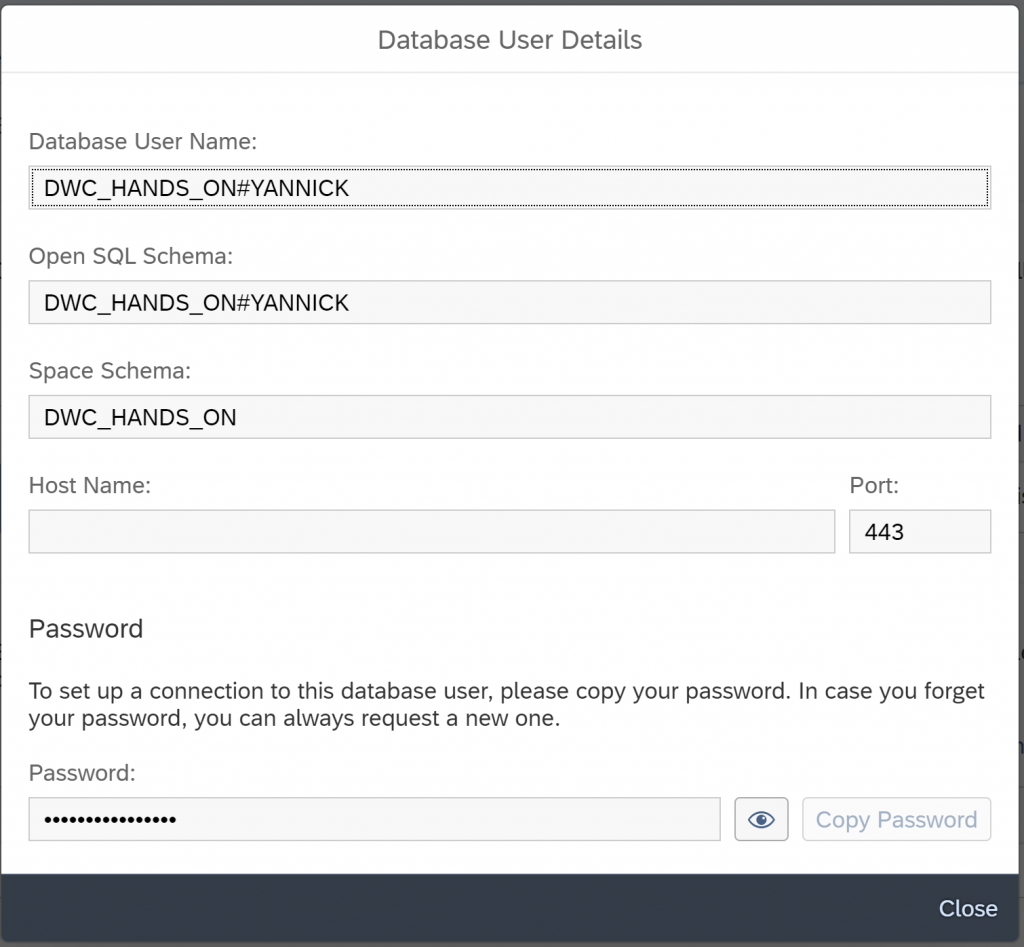
Now, the data scientist can take over. Just like in the following HANA cloud tutorial create a new HANA Key to store the credentials. Hence, open your command prompt and execute the following command with your login information.
C:\Program Files\SAP\hdbclient>hdbuserstore -i SET MYDWC “YOURENDPOINT:PORT” YOURUSERNAME
In your Jupyter Notebook login through the following command. The Python script as well as the data are available under the following Github repository.

In addition, please update the path to the dataset at the beginning as well as the schema of the Model storage at the end of the notebook.


Then run all bellow cell number 5, after establishing the connection.

After all cells are executed successfully, add a new cell at the bottom and execute the following Python script. This will save a new table with the predictions in HANA cloud.
result.save(where = 'PREDICTIONS')
Now, the business user can take over in DWC and join the data together for further consumption, for example in SAP Analytics Cloud. Hence, move to the “Data Builder” in DWC.
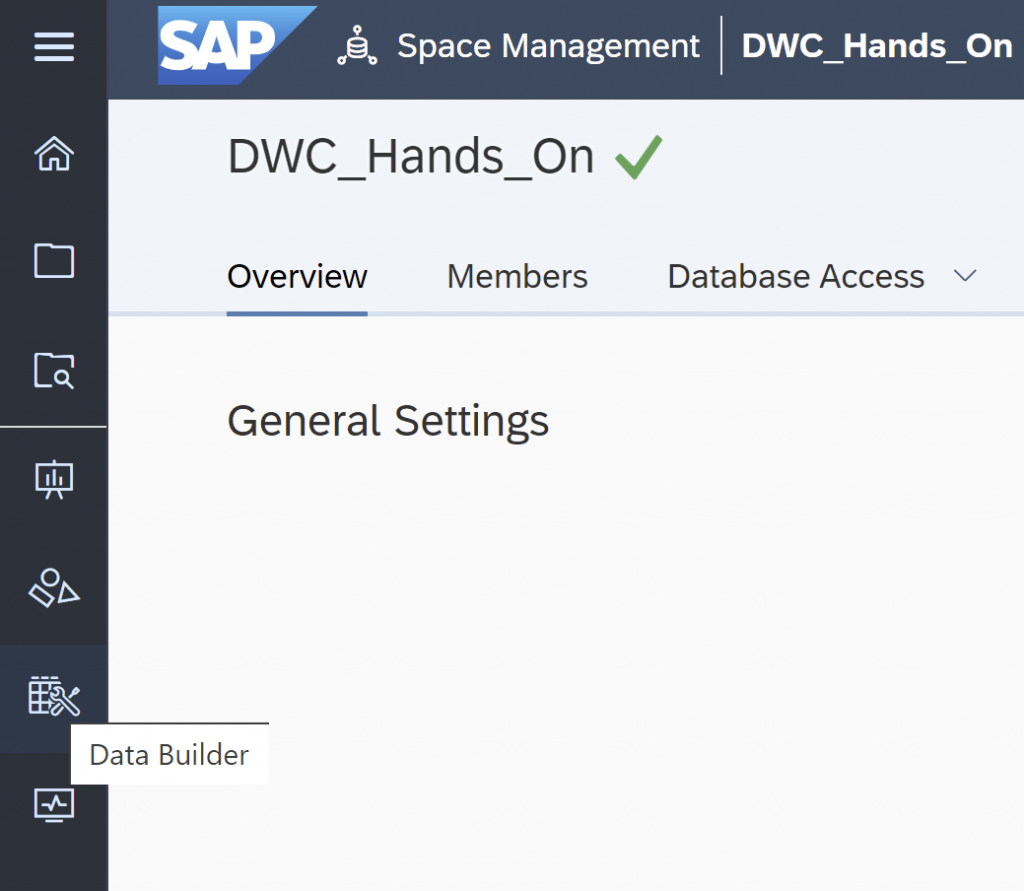
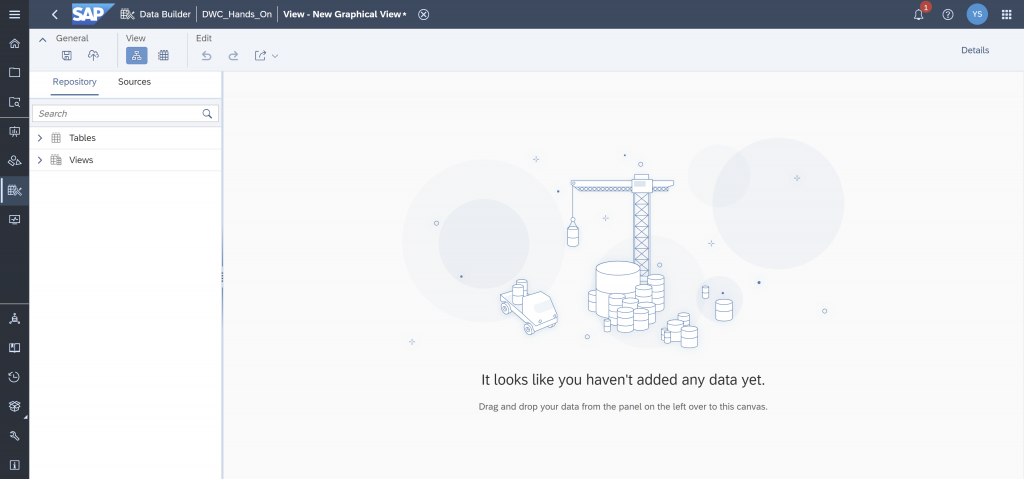
Make sure that you are in the right space and choose “New Graphical View”.

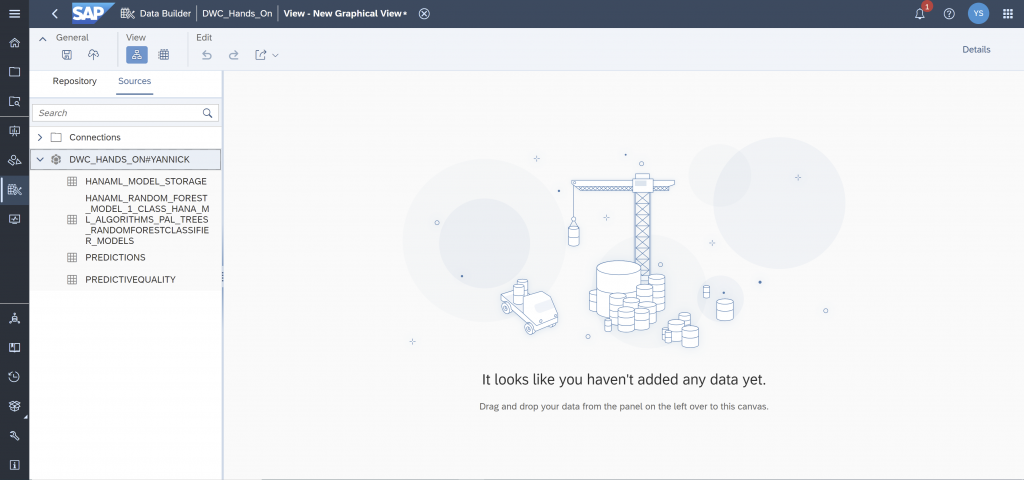
Click “Sources”.
There you find the predictions as well as the original dataset. Let’s join them together.
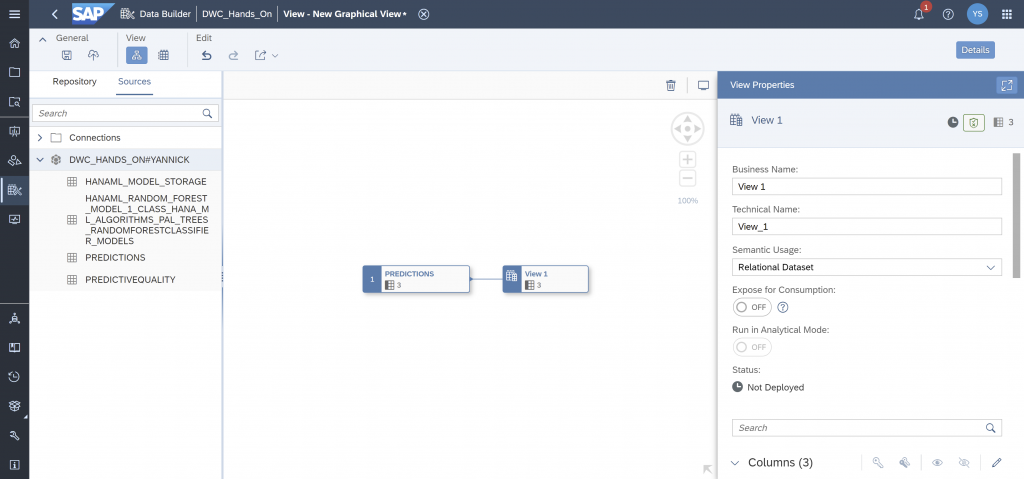
Drag & drop the “PREDICTIONS” into the working area.
Now, drag & drop the dataset “PREDICTIVEQUALITY” on to the “PREDICTIONS” dataset and join them together.
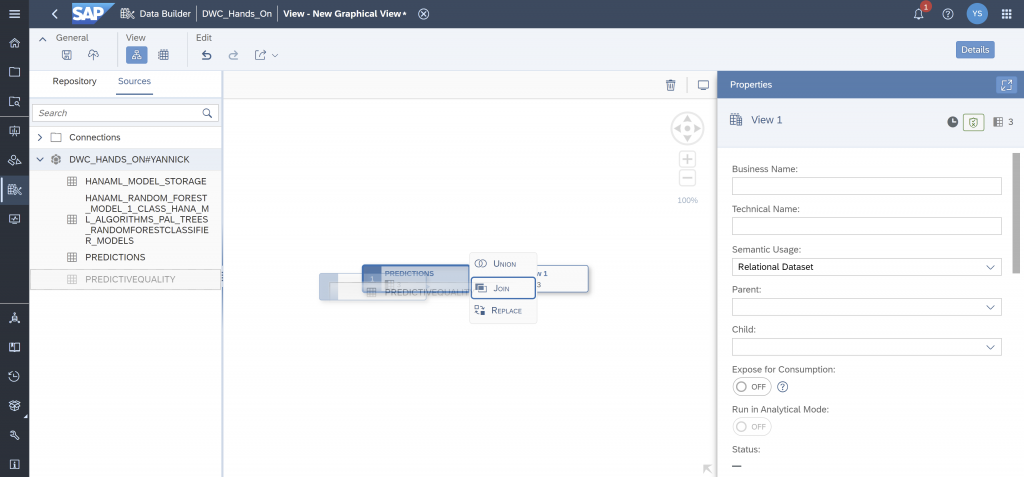
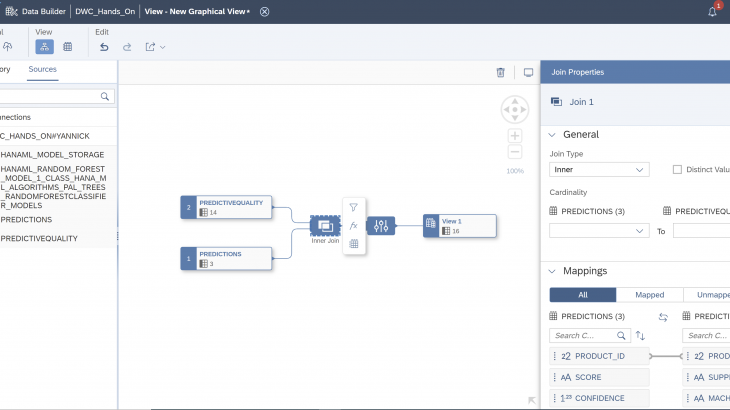
This will create the following graph.
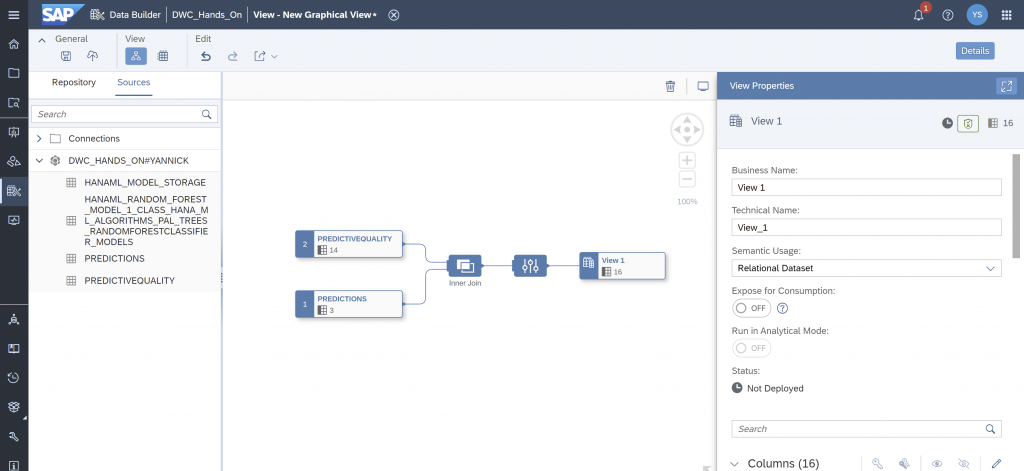
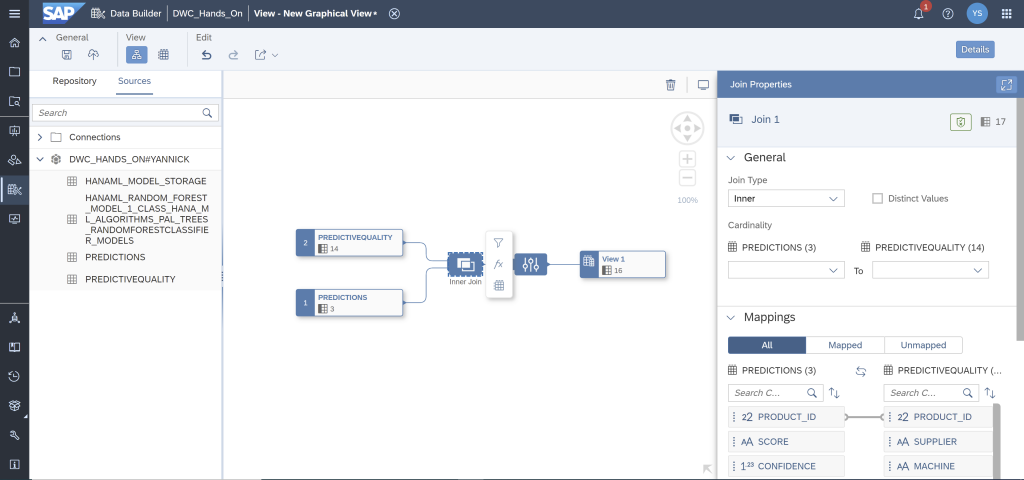
Tap on to the join operator and control the properties. An inner join is established over the unique product ID variable. The joined table contains all the rows of the “PREDICTIVEQUALITY” dataset for which there is a prediction.
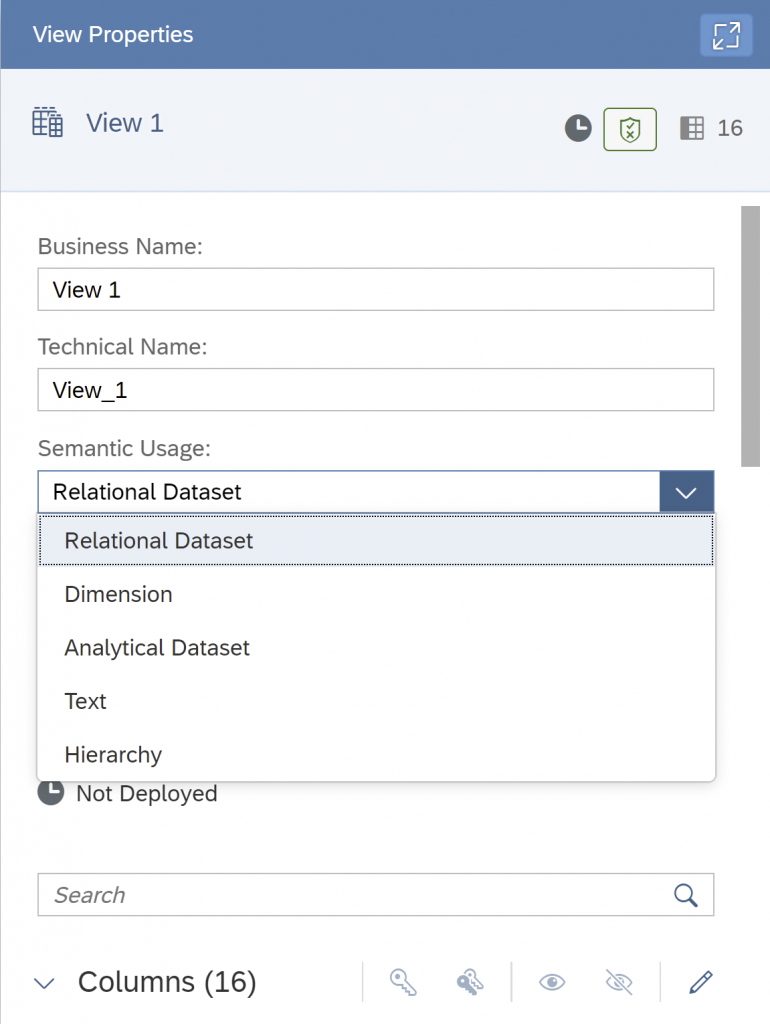
Next, configure the view with the goal to consume the data in SAP Analytics Cloud. Tap on to the View operator. Change the Semantic Usage to “Analytical Dataset”.
Click “Expose for Consumption” on.
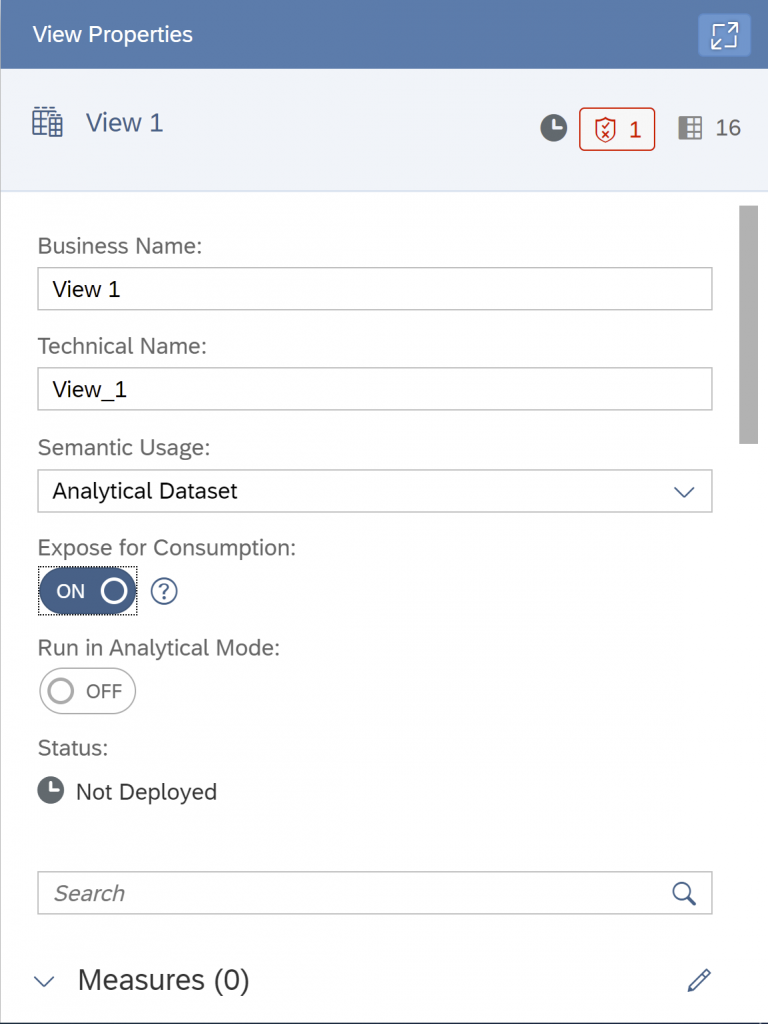
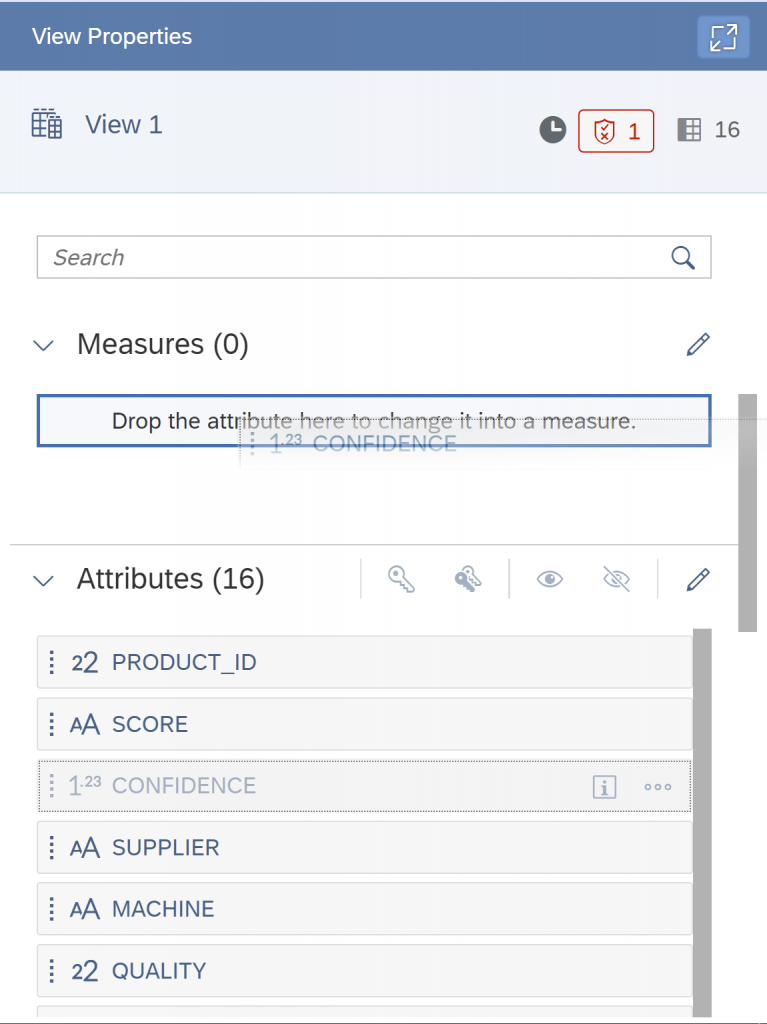
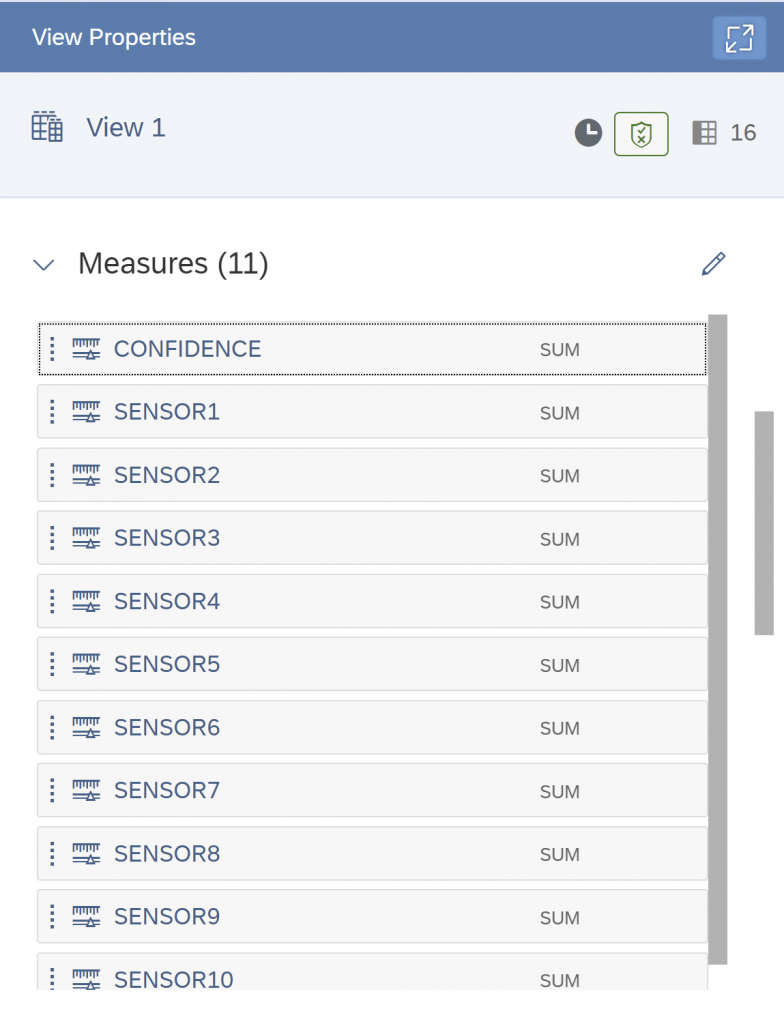
In addition, drag & drop the numeric variables to “Measures”.
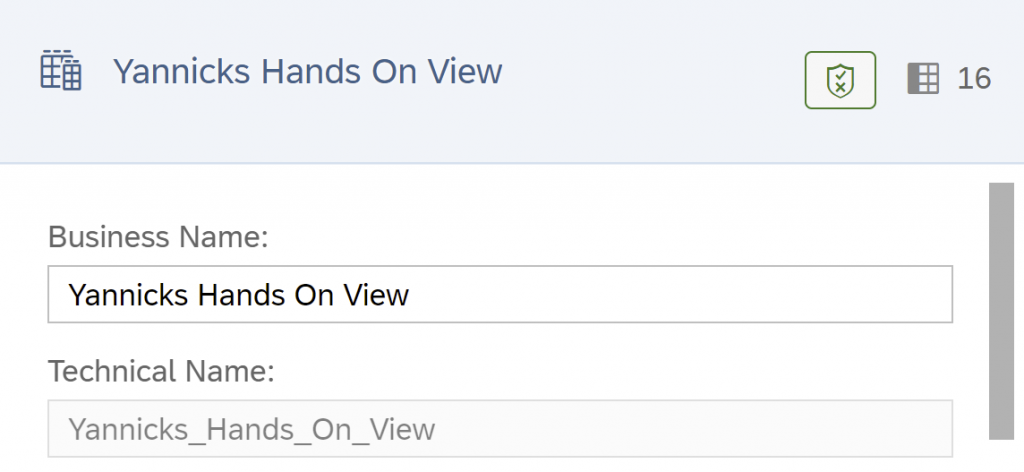
Before the deployment name the View to “Name Hands On View”.
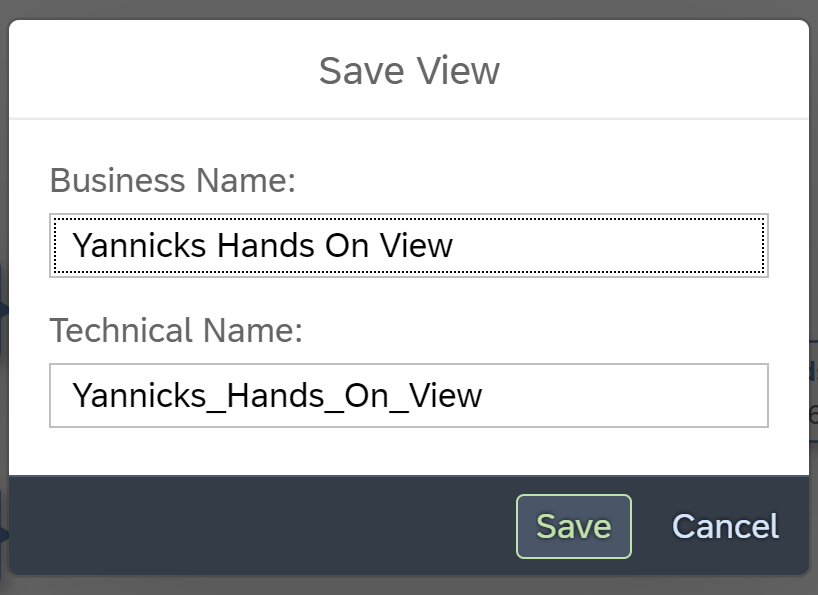
Save your scenario.

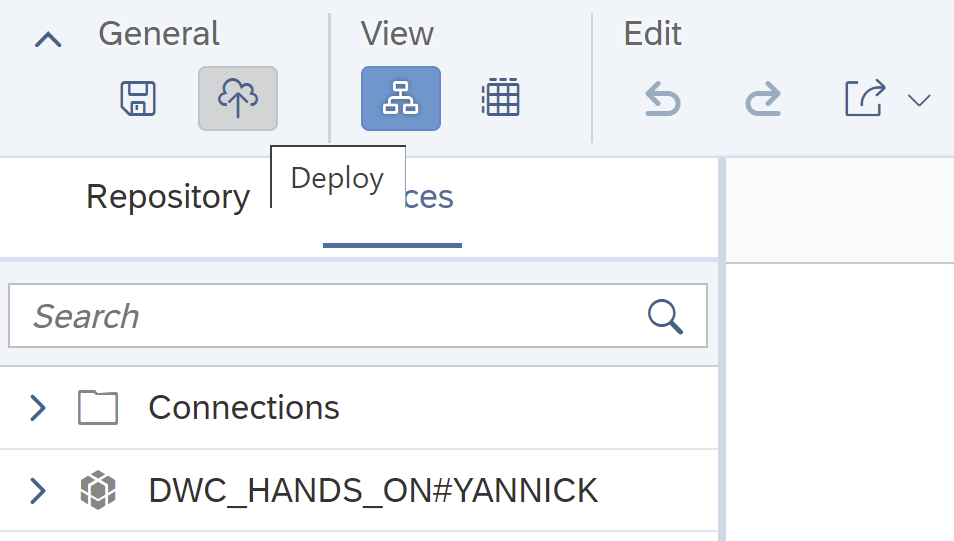
After the processing is complete, choose “Deploy” at the top left.
Wait for the success message.

