Once upon a time not so long ago, while working on a project, I came across some very unique requirements (atleast at that time I thought so) from the customer. The project involved an implementation for PM/GM and the customer process had some requirements that really got us to explore the PM solution of Successfactors. Thankfully, we found the PM functionality flexible enough to accommodate such requirements.
The below example is “inspired” by the customer’s requirements. However, I have added some additional requirements to demonstrate that bit more which could have also been done had it been required.
Requirements:
1. Section Ratings:
- Sections will be rated as A/B/C/D. A being the best rating.
- This rating is auto-calculated based on the individual elements’ ratings in the section.
- The section rating gets decided uniquely for each section.
2. Overall Rating
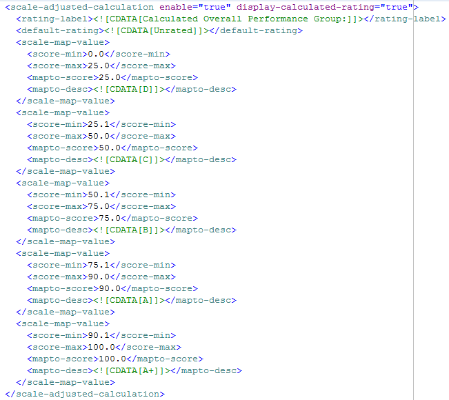
- Based on the overall score, the overall rating is calculated as below
| Score | Label |
| 0 – 25 | D |
| 25 – 50 | C |
| 50 – 75 | B |
| 75 – 90 | A |
| 90 – 100 | A+ |
3. 3 Goals sections
- Goals are weighted. Each section is weighted for the overall rating.
- Goal ratings are calculated using MLT table set-up for each goal.
- Ratings are in percentages for all 3 goal sections.
- Section rating to be calculated as
| Section Score | Label |
| 0 – 25 | D |
| 25 – 50 | C |
| 50 – 75 | B |
| 75 – 90 | A |
4. 1 Core competencies section
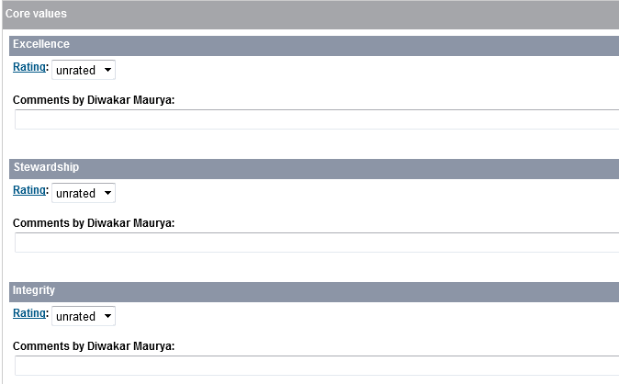
- Contains 3 fixed competencies.
- Competencies are not weighted. However, section is weighted for overall rating.
- Person either possesses the competency or does not. [Yes/No]
- Section rating for this section is to be calculated as
| Section Score | Label |
| 3 Yes | A |
| 2 Yes | B |
| 1 Yes | C |
| 0 Yes | D |
5. 1 Competency section called Performance Factors
- Section contains 4 fixed competencies.
- Competencies are not weighted. However, section is weighted for overall rating.
- Competencies are rated as A/B/C/D. A being the best rating.
- Section rating is calculated based on the number of “A” ratings obtained by the person.
- The customer also wanted to maintain competencies being rated as A/B/C/D.
- Section rating is calculated as
| Score | Label |
| >3 “A” | A |
| 2 “A” | B |
| 1 “A” | C |
| 0 “A” | D |
Solution Approach:
You would notice that the individual ratings first converge to a section rating, which then further contributes to overall rating which is a different rating scale from both the section and individual rating scales.
Keeping the above requirements in mind, the first challenge was to determine the rating scale values so that the requirements for section ratings can be met. These are described for individual sections as below.
Goals Sections
This was the easiest since the scale used by Goals was a percentage scale.
We defined just the 2 extreme ratings since the rating calculation was based on a MLT table.
Alternatively, a rating scale of 0 – 100 integer values could have been defined, but this not much of use.
Since the section rating scale is percentage scale, the mapping of section ratings will be identical to overall rating score mapping as shown below.
| Section Score | Label |
| 75 – 100 | A |
| 50 – 75 | B |
| 25 – 50 | C |
| 0 – 25 | D |
Core Competency section:
It was decided to stick to values 0 and 100 since this scale will require just 2 ratings [Yes/No].
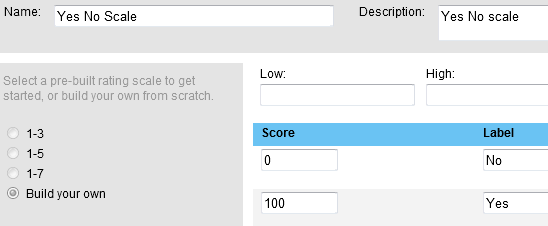
Since the competencies will be 3 in number and equally weighted, the section ratings of A/B/C/D can be arrived at as
| Score | Score Range | Label |
| 3 Yes | 75 – 100 | A |
| 2 Yes | 50 – 75 | B |
| 1 Yes | 25 – 50 | C |
| 0 Yes | 0 – 25 | D |
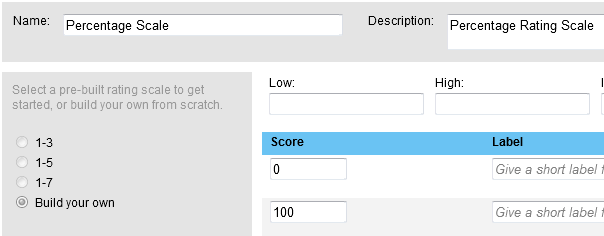
Performance Factors section:
This was by far the trickiest one. Since the section rating was based on only the highest rating, to uniquely determine the scores, it was necessary to arrive at a unique score for all combinations of A/B/C/D ratings.
A quick check will reveal that this is not possible by assigning equidistant values to individual A/B/C/D ratings. Hence it was decided that the A/B/C/D scale be an uneven rating scale. (There are some other findings on how this affects the rating calculations. To keep this post coherent and not make it obnoxiously long, I shall share them in my next blog post.)
For this section, we set up the Rating scale as below.
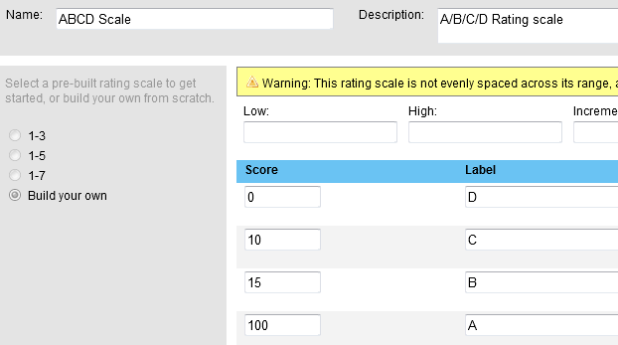
With these ratings, the section rating requirements can be met by defining the section rating ranges as below. These can be arrived at by totaling the individual rating score and divide by 4. (divide by 4 since the number of ratings are 4).
| Ratings | Score Range | Label |
| >3 A | 75 – 100 | A |
| 2 A | 50 – 73 | B |
| 1 A | 25 – 49 | C |
| 0 A | 0 – 24 | D |
Using the scale-adjusted-calculation method
In the <fm-meta> section
The scale-adjusted-calculation function has been used and well documented when used in the <fm-meta> section of the XML template. We used the same to map the ranges as per the ratings, from D to A+.
In the Individual sections:
While the use of in meta section is well known, its use in the Goals and Competencies sections is not as well documented.
There are 4 main components in each mapping element of <scale-map-value>
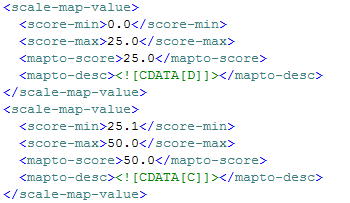
For each of the Goals and Competencies sections, these were mapped as below.
Goals sections:
| score-min | score-max | mapto-score | mapto-desc |
| 0.0 | 25.0 | 25.0 | D |
| 25.1 | 50.0 | 50.0 | C |
| 50.1 | 75.0 | 75.0 | B |
| 75.1 | 100.0 | 100.0 | A |
Core Competency section:
| score-min | score-max | mapto-score | mapto-desc |
| 0.0 | 25.0 | 25.0 | D |
| 25.1 | 50.0 | 50.0 | C |
| 50.1 | 75.0 | 75.0 | B |
| 75.1 | 100.0 | 100.0 | A |
Performance Factors section:
| score-min | score-max | mapto-score | mapto-desc |
| 0.0 | 24.0 | 25.0 | D |
| 25.1 | 49.0 | 50.0 | C |
| 50.1 | 73.0 | 75.0 | B |
| 75.1 | 100.0 | 100.0 | A |
How does scale adjustment in Goals and Competencies sections affect score calculations?
Unlike its use in the meta section, using scale-adjustment in individual sections of the form does not have only the mapping effect. Since the individual sections of the form contribute directly to the overall-score calculation, scale-adjustment also affects the section score.
Once we map actual score (sum of individual goal/competency scores in the section) to ranges and a particular score, the system internally creates its own rating scale to distribute the section weight.
After a lot of deliberation and trials, we found that the section’s contribution to overall score follows the following formula:
Section score = (Current section rating value – min section Rating value)
————————————————————————- * section weight
(Max section rating value – min section rating value)
Let’s illustrate this with the help of an example.
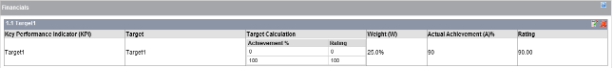
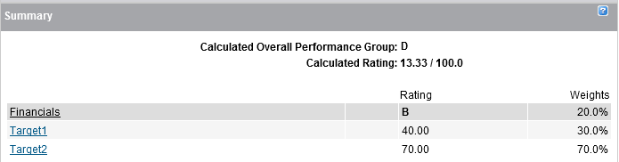
Below is a screenshot of the summary section at a time when only one section has been rated with all other sections ratings are zero.
This is one of the goals section described earlier, and the section rating mapping is as below.
| score-min | score-max | mapto-score | mapto-desc |
| 0.0 | 25.0 | 25.0 | D |
| 25.1 | 50.0 | 50.0 | C |
| 50.1 | 75.0 | 75.0 | B |
| 75.1 | 100.0 | 100.0 | A |
In this case, the “Calculated Rating” is calculated as below.
Sum of Goals rating = (40*30% + 70*70%) = 12+49 = 61 -> Maps to B with section rating = 75
Therefore, the contribution to overall score is calculated as
Overall score = (Current rating – min rating)/(max rating – min rating)*weight
= (75 – 25)/(100 – 25)*20 = 13.33
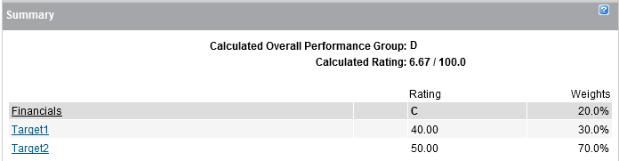
Similarly, if the ratings for individual goals are reduced, it results in reduction of overall score.
Sum of Goals rating = (40*30% + 50*70%) = 12+35 = 47 -> Maps to C with section rating = 50
Therefore, the contribution to overall score is calculated as
Overall score = (Current rating – min rating)/(max rating – min rating)*weight
= (75 – 50)/(100 – 25)*20 = 6.67
This formula behaves consistently over all the sections and does not depend on the number of levels in the mapped rating scale.
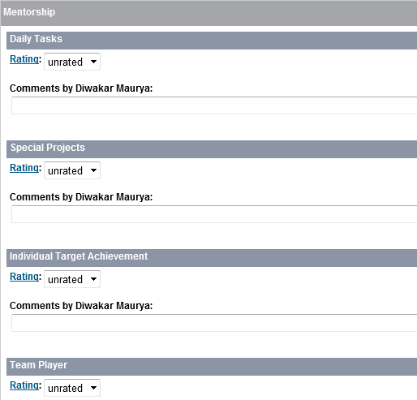
Below is another example of the complete summary section with mapped ratings in sections and for overall rating.
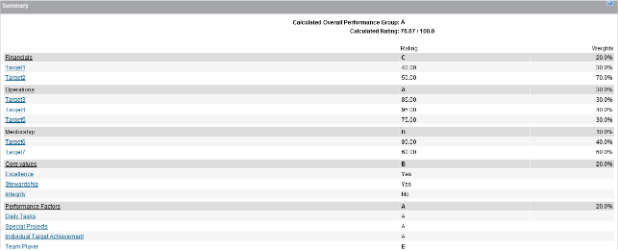
To conclude, the above example demonstrates that
- Multiple rating scales can be used through the form and made to converge to one rating scale
- Using scale adjustments in the individual sections allows some additional levers to meet or fine tune some unique requirements from customer PM processes.


